# fbr::with_proxy(devtools::install_github('hadley/nycflights13'))
library(nycflights13)
library(dplyr)
library(ggplot2)
library(rlang) # for sym()
library(purrr) # for walk()
ggthemr::ggthemr(palette = "flat", type = "outer")
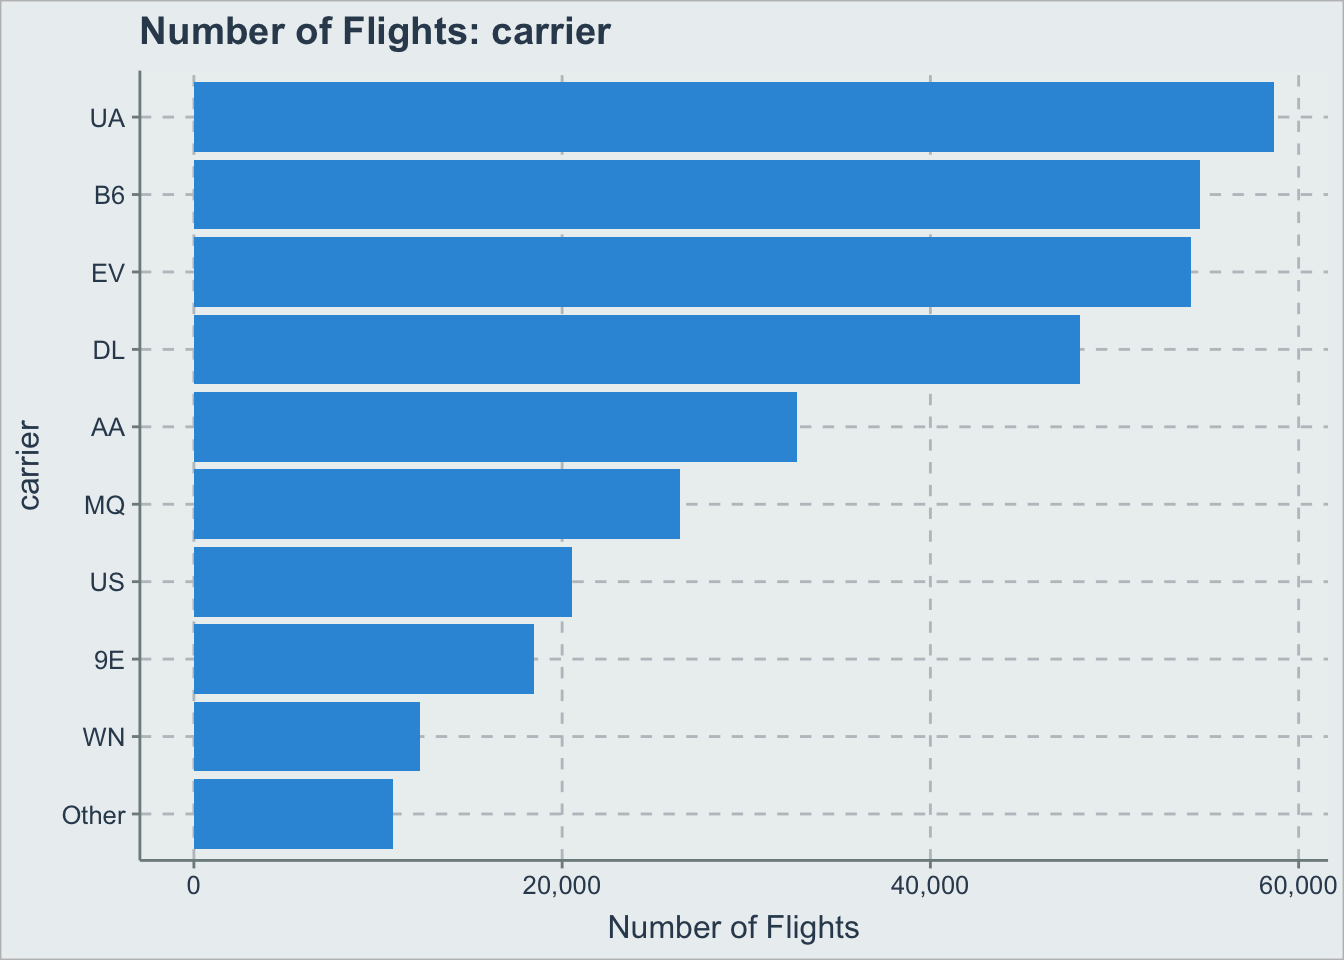
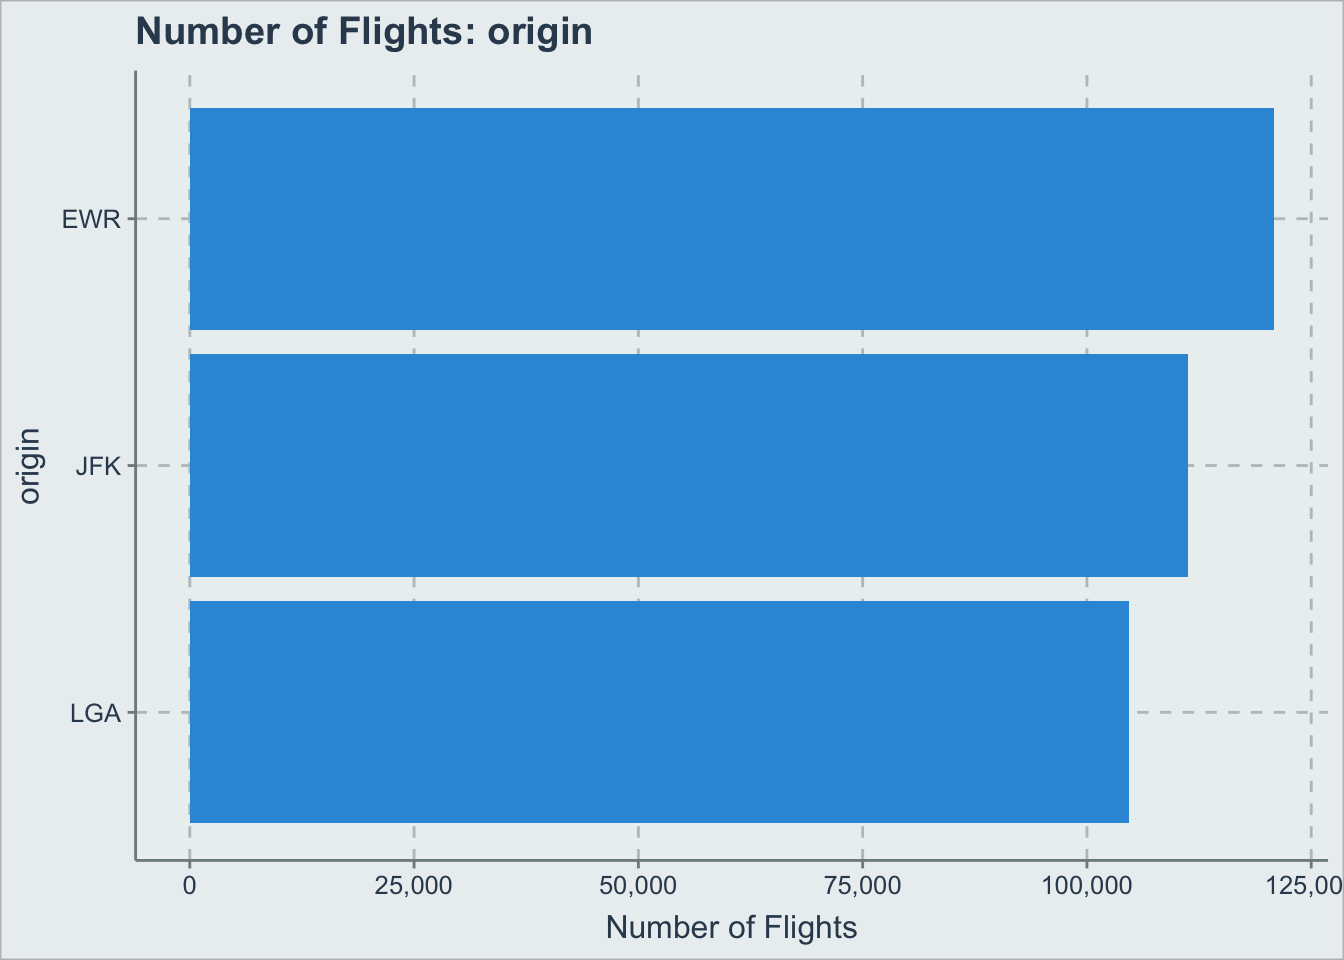
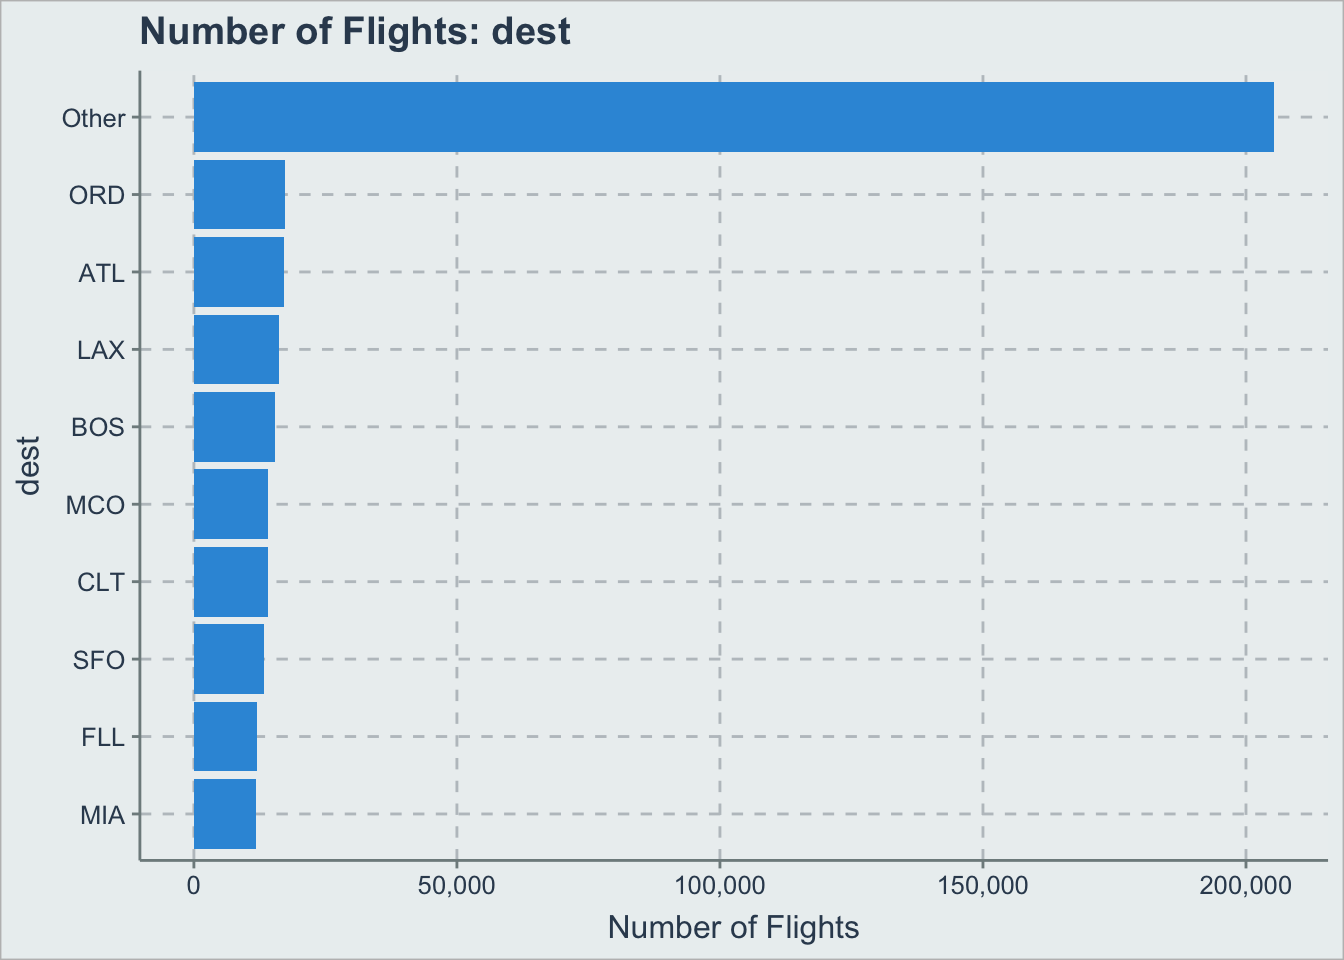
plot_group <- function(group_var) {
x <- flights %>%
# !!sym() isn't recommended
# see https://twitter.com/hadleywickham/status/1182624340887638016
# group_by(!!sym(group_var)) %>%
group_by(.data[[group_var]]) %>%
tally(name = "n_flights") %>%
arrange(-n_flights) %>%
mutate(
d = as.factor(!!sym(group_var)),
d_lumped = forcats::fct_lump(
d,
n = 9,
w = n_flights
),
na_level = "Other"
) %>%
group_by(d_lumped) %>%
summarise(n_flights = sum(n_flights)) %>%
ungroup() %>%
mutate(
d_lumped = forcats::fct_reorder(d_lumped, n_flights)
)
p <- ggplot(
x,
aes(x = d_lumped, y = n_flights)
) +
geom_col() +
scale_y_continuous(labels = scales::comma) +
coord_flip() +
labs(
title = glue::glue("Number of Flights: {group_var}"),
x = glue::glue("{group_var}"),
y = "Number of Flights"
) +
theme(plot.background = element_rect(fill = "#EBF0F1", color = "grey"))
print(p)
}
dims <- c("carrier", "origin", "dest")

purrr::walk(dims, plot_group)