Expand Grids with...`expand.grid()`
Feb 2018 · 243 words · 2 minutes read

COPY / PASTE HERE:
expand.grid(seq(0,10), seq(0,10), seq(0,10))
Another quick one but useful. I recently had a use-case at work where I was plotting datapoints of events on a 2d canvas. We had thousands of clients and a unique canvas where I needed to paint thousands of events for each client. I decided to normalize everything to a 0-100 scale across the x and y dimensions. The problem which prompted me to use expand.grid() was that I didn’t have obserations for each x,y pair within the 0-100 grid. I needed to create a table in my database which I could join on in order to create records for these missing values and COALESCE() missing pairs to 0’s.
I took 10 seconds to create a 10,000 record table using expand.grid( seq(0,100), seq(0,100)). This created a unique record for each possible pairing of x and y values in the 0 - 100 sequences. I then uploaded this table to my db and got what I needed.
seq1 <- seq(1,100)

big.grid <- expand.grid(seq1,seq1)

head(big.grid)
## Var1 Var2
## 1 1 1
## 2 2 1
## 3 3 1
## 4 4 1
## 5 5 1
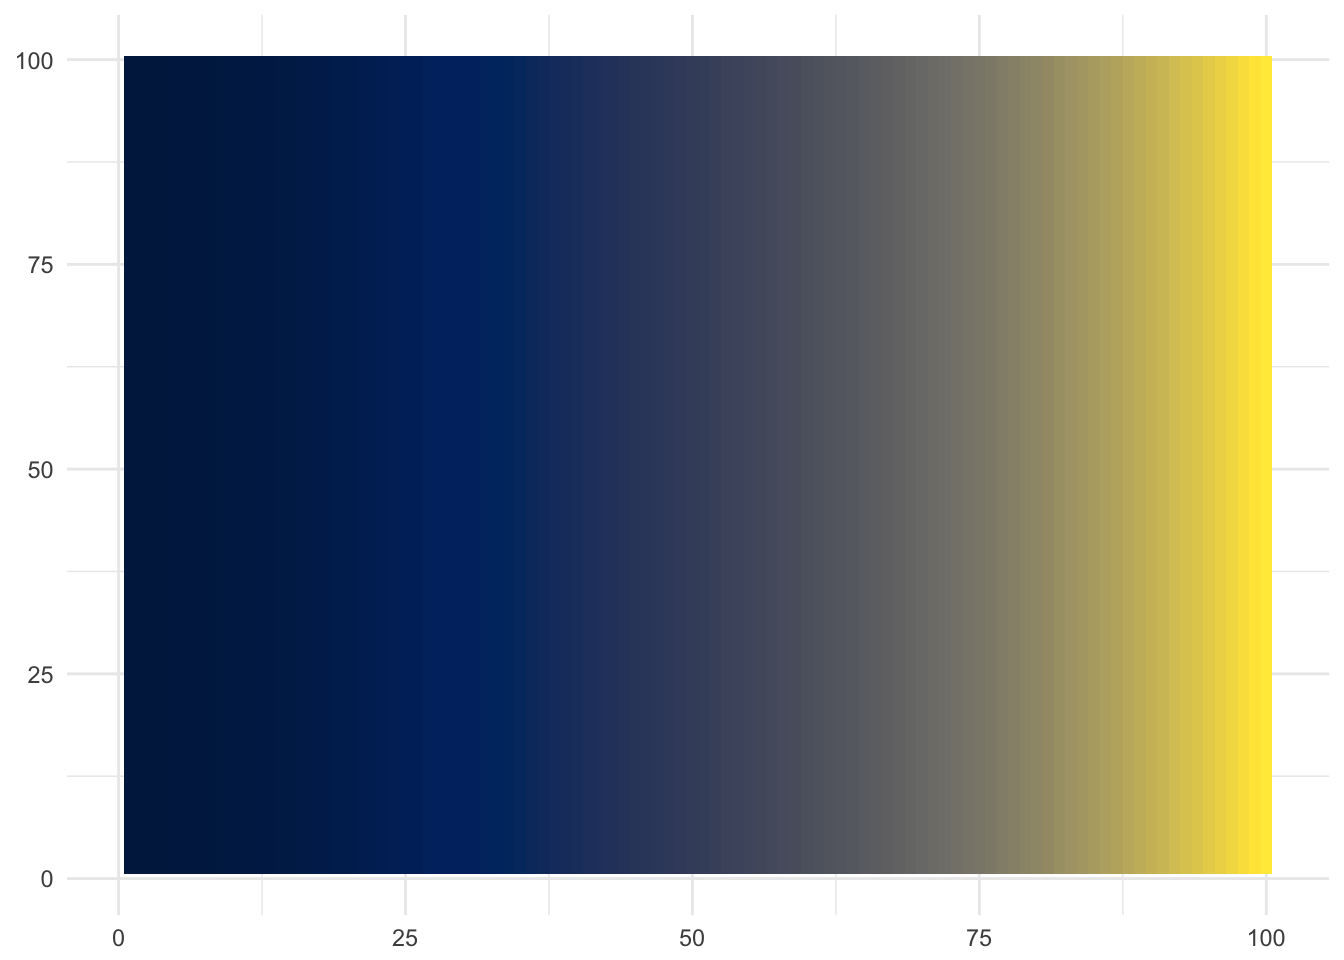
## 6 6 1nrow(big.grid)## [1] 10000plot.df <- big.grid %>%
mutate(value = Var1^2)
ggplot(
plot.df
, aes(
x = Var1
, y = Var2
, fill = value
)
) +
geom_tile() +
theme_minimal() +
theme(legend.position = 'none', axis.title = element_blank()) +
scale_fill_viridis(option = 'E')