The Train Schedule
Oct 2017 · 2096 words · 10 minutes read

This website needs content. I don’t really know what to write at the moment so I’m going to just start with a simple recreation of a famous old ( originally made 137 years ago) visualization to get things rolling. I could have chosen to write about Napoleon’s infamous march but plenty of people wrote about that already.
I recently purchased a copy of https://www.amazon.co.uk/Visual-Display-Quantitative-Information/dp/0961392142 by Edward Tufte. The cover image is a photo of E.J. Marey’s visualization of train scheduls for Paris to Lyon. I’ll go ahead and try to recreate this in R.
First, let’s load the packages we need.
library( readr) # read in data
library( tidyr) # clean it up
library( dplyr) # make love to the clay
library( magrittr) # %<>%
library( ggplot2) # Viz
library( viridis) # Pretty colors
library( lubridate) # Time sucks
library( purrr) # Apply functions over df
library( knitr) # kable()
Forunately, the fabled deity Mike Bostock has done this before and uploaded the data to his github already.
Let’s use that.
# td means 'Train Data'
td <- read_tsv("https://gist.githubusercontent.com/mbostock/5544008/raw/446592acc3a9223ad268c7b051a68b814e40789c/schedule.tsv")

td_backup <- td
That’s nice. Let’s see what we just got.
glimpse(td)## Observations: 122
## Variables: 34
## $ number <int> 102, 104, 206, 208, 210, 312, 3...
## $ type <chr> "N", "N", "L", "L", "L", "B", "...
## $ direction <chr> "S", "S", "S", "S", "S", "S", "...
## $ `stop|San Francisco|0|1` <time> 04:55:00, 05:25:00, 06:11:00, ...
## $ `stop|22nd Street|40|1` <chr> "5:00am", "5:30am", "6:16am", "...
## $ `stop|Bayshore|124|1` <chr> "5:05am", "5:35am", "-", "6:34a...
## $ `stop|So. San Francisco|178|1` <chr> "5:11am", "5:41am", "-", "6:40a...
## $ `stop|San Bruno|216|1` <chr> "5:15am", "5:45am", "-", "6:44a...
## $ `stop|Millbrae|249|2` <chr> "5:19am", "5:49am", "6:29am", "...
## $ `stop|Broadway|280|2` <chr> "-", "-", "-", "-", "-", "-", "...
## $ `stop|Burlingame|307|2` <chr> "5:23am", "5:53am", "6:33am", "...
## $ `stop|San Mateo|334|2` <chr> "5:26am", "5:56am", "6:36am", "...
## $ `stop|Hayward Park|354|2` <chr> "5:29am", "5:59am", "-", "6:58a...
## $ `stop|Hillsdale|391|2` <chr> "5:32am", "6:02am", "6:40am", "...
## $ `stop|Belmont|428|2` <chr> "5:35am", "6:05am", "-", "7:04a...
## $ `stop|San Carlos|458|2` <chr> "5:38am", "6:08am", "6:44am", "...
## $ `stop|Redwood City|499|2` <chr> "5:43am", "6:13am", "6:49am", "...
## $ `stop|Atherton|543|3` <chr> "-", "-", "-", "-", "-", "-", "...
## $ `stop|Menlo Park|574|3` <chr> "5:48am", "6:18am", "6:54am", "...
## $ `stop|Palo Alto|604|3` <chr> "5:51am", "6:21am", "6:57am", "...
## $ `stop|California Ave|649|3` <chr> "5:55am", "6:25am", "7:01am", "...
## $ `stop|San Antonio|676|3` <chr> "5:59am", "6:29am", "-", "-", "...
## $ `stop|Mountain View|702|3` <chr> "6:03am", "6:33am", "7:07am", "...
## $ `stop|Sunnyvale|731|3` <chr> "6:08am", "6:38am", "-", "-", "...
## $ `stop|Lawrence|757|4` <chr> "6:12am", "6:42am", "7:12am", "...
## $ `stop|Santa Clara|805|4` <chr> "6:17am", "6:47am", "-", "7:34a...
## $ `stop|College Park|833|4` <chr> "-", "-", "-", "-", "7:59am", "...
## $ `stop|San Jose|862|4` <time> 06:26:00, 06:56:00, 07:24:00, ...
## $ `stop|Tamien|906|4` <chr> "X", "7:03am", "X", "7:50am", "...
## $ `stop|Capitol|939|5` <chr> "X", "X", "X", "X", "X", "X", "...
## $ `stop|Blossom Hill|966|5` <chr> "X", "X", "X", "X", "X", "X", "...
## $ `stop|Morgan Hill|997|6` <chr> "X", "X", "X", "X", "X", "X", "...
## $ `stop|San Martin|1021|6` <chr> "X", "X", "X", "X", "X", "X", "...
## $ `stop|Gilroy|1053|6` <chr> "X", "X", "X", "X", "X", "X", "...What am I looking at? SF, South SF, Millbrae, Burlingame, San Mateo, MPK, Palo Alto. The nightmare of the 101 commute is on my computer screen again. This is the train schedule for the Bay Area instead of Paris -> Lyon. That’s gross and dissapointing.
Anyway, how many rows are in this table?
nrow(td)## [1] 122Let’s change the column names so they’re a bit easier to work with.
colnames(td) <- c(
  'number'            ,'type'                ,'direction'
  ,'san_francisco'    ,'twentysecond_street' ,'bayshore'
  ,'so_san_francisco' ,'san_bruno'           ,'millbrae'
  ,'broadway'         ,'burlingame'          ,'san_mateo'
  ,'hayward_park'     ,'hillsdale'           ,'belmont'
  ,'san_carlos'       ,'redwood_city'        ,'atherton'
  ,'menlo_park'       ,'palo_alto'           ,'california_ave'
  ,'san_antonio'      ,'mountainview'        ,'sunnyvale'
  ,'lawrence'         ,'santaclara'          ,'college_park'
  ,'san_jose'         ,'tamien'              ,'capitol'
  ,'blossom_hill'     ,'morgan_hill'         ,'san_martin'
  ,'gilroy'
)

glimpse(td)
## Observations: 122
## Variables: 34
## $ number <int> 102, 104, 206, 208, 210, 312, 314, 216, 21...
## $ type <chr> "N", "N", "L", "L", "L", "B", "B", "L", "L...
## $ direction <chr> "S", "S", "S", "S", "S", "S", "S", "S", "S...
## $ san_francisco <time> 04:55:00, 05:25:00, 06:11:00, 06:24:00, 0...
## $ twentysecond_street <chr> "5:00am", "5:30am", "6:16am", "6:29am", "6...
## $ bayshore <chr> "5:05am", "5:35am", "-", "6:34am", "-", "-...
## $ so_san_francisco <chr> "5:11am", "5:41am", "-", "6:40am", "-", "-...
## $ san_bruno <chr> "5:15am", "5:45am", "-", "6:44am", "-", "-...
## $ millbrae <chr> "5:19am", "5:49am", "6:29am", "6:48am", "7...
## $ broadway <chr> "-", "-", "-", "-", "-", "-", "-", "-", "-...
## $ burlingame <chr> "5:23am", "5:53am", "6:33am", "6:52am", "-...
## $ san_mateo <chr> "5:26am", "5:56am", "6:36am", "6:55am", "7...
## $ hayward_park <chr> "5:29am", "5:59am", "-", "6:58am", "-", "-...
## $ hillsdale <chr> "5:32am", "6:02am", "6:40am", "7:01am", "-...
## $ belmont <chr> "5:35am", "6:05am", "-", "7:04am", "-", "-...
## $ san_carlos <chr> "5:38am", "6:08am", "6:44am", "i7:07am", "...
## $ redwood_city <chr> "5:43am", "6:13am", "6:49am", "i7:12am", "...
## $ atherton <chr> "-", "-", "-", "-", "-", "-", "-", "-", "-...
## $ menlo_park <chr> "5:48am", "6:18am", "6:54am", "-", "7:23am...
## $ palo_alto <chr> "5:51am", "6:21am", "6:57am", "7:18am", "7...
## $ california_ave <chr> "5:55am", "6:25am", "7:01am", "-", "7:30am...
## $ san_antonio <chr> "5:59am", "6:29am", "-", "-", "7:34am", "-...
## $ mountainview <chr> "6:03am", "6:33am", "7:07am", "-", "7:38am...
## $ sunnyvale <chr> "6:08am", "6:38am", "-", "-", "7:43am", "-...
## $ lawrence <chr> "6:12am", "6:42am", "7:12am", "-", "7:49am...
## $ santaclara <chr> "6:17am", "6:47am", "-", "7:34am", "7:56am...
## $ college_park <chr> "-", "-", "-", "-", "7:59am", "-", "-", "-...
## $ san_jose <time> 06:26:00, 06:56:00, 07:24:00, 07:43:00, 0...
## $ tamien <chr> "X", "7:03am", "X", "7:50am", "8:13am", "X...
## $ capitol <chr> "X", "X", "X", "X", "X", "X", "X", "X", "X...
## $ blossom_hill <chr> "X", "X", "X", "X", "X", "X", "X", "X", "X...
## $ morgan_hill <chr> "X", "X", "X", "X", "X", "X", "X", "X", "X...
## $ san_martin <chr> "X", "X", "X", "X", "X", "X", "X", "X", "X...
## $ gilroy <chr> "X", "X", "X", "X", "X", "X", "X", "X", "X...So what do we notice about our data?
- The
numberfield looks like a train number. We’ll make a unique line for eachnumberin our visualization. - San Francisco and San Jose are the start and stop points. They also have different time formats than the other fields. We should probably coerce all timestamps to the same format just for simplification purposes.
- Direction indicates whether the train is moving from SF -> San Jose or vice-versa.
Let’s start by coercing the the different timestamps to the same timestamp format. For this we’ll use the lubridate::parse_time() function.
The timestamps for the intermediate stations are in the format %I:%M%p e.g. 7:04am.
The SF and San Jose columns are in the more straightforward %H:%M:%s format.
We’ll convert these before we visualize. For now, we’ll convert all time columns to a character.
td %<>%
  mutate(
    san_francisco = as.character(san_francisco)
    ,san_jose = as.character(san_jose)
  )

glimpse(td)
## Observations: 122
## Variables: 34
## $ number <int> 102, 104, 206, 208, 210, 312, 314, 216, 21...
## $ type <chr> "N", "N", "L", "L", "L", "B", "B", "L", "L...
## $ direction <chr> "S", "S", "S", "S", "S", "S", "S", "S", "S...
## $ san_francisco <chr> "04:55:00", "05:25:00", "06:11:00", "06:24...
## $ twentysecond_street <chr> "5:00am", "5:30am", "6:16am", "6:29am", "6...
## $ bayshore <chr> "5:05am", "5:35am", "-", "6:34am", "-", "-...
## $ so_san_francisco <chr> "5:11am", "5:41am", "-", "6:40am", "-", "-...
## $ san_bruno <chr> "5:15am", "5:45am", "-", "6:44am", "-", "-...
## $ millbrae <chr> "5:19am", "5:49am", "6:29am", "6:48am", "7...
## $ broadway <chr> "-", "-", "-", "-", "-", "-", "-", "-", "-...
## $ burlingame <chr> "5:23am", "5:53am", "6:33am", "6:52am", "-...
## $ san_mateo <chr> "5:26am", "5:56am", "6:36am", "6:55am", "7...
## $ hayward_park <chr> "5:29am", "5:59am", "-", "6:58am", "-", "-...
## $ hillsdale <chr> "5:32am", "6:02am", "6:40am", "7:01am", "-...
## $ belmont <chr> "5:35am", "6:05am", "-", "7:04am", "-", "-...
## $ san_carlos <chr> "5:38am", "6:08am", "6:44am", "i7:07am", "...
## $ redwood_city <chr> "5:43am", "6:13am", "6:49am", "i7:12am", "...
## $ atherton <chr> "-", "-", "-", "-", "-", "-", "-", "-", "-...
## $ menlo_park <chr> "5:48am", "6:18am", "6:54am", "-", "7:23am...
## $ palo_alto <chr> "5:51am", "6:21am", "6:57am", "7:18am", "7...
## $ california_ave <chr> "5:55am", "6:25am", "7:01am", "-", "7:30am...
## $ san_antonio <chr> "5:59am", "6:29am", "-", "-", "7:34am", "-...
## $ mountainview <chr> "6:03am", "6:33am", "7:07am", "-", "7:38am...
## $ sunnyvale <chr> "6:08am", "6:38am", "-", "-", "7:43am", "-...
## $ lawrence <chr> "6:12am", "6:42am", "7:12am", "-", "7:49am...
## $ santaclara <chr> "6:17am", "6:47am", "-", "7:34am", "7:56am...
## $ college_park <chr> "-", "-", "-", "-", "7:59am", "-", "-", "-...
## $ san_jose <chr> "06:26:00", "06:56:00", "07:24:00", "07:43...
## $ tamien <chr> "X", "7:03am", "X", "7:50am", "8:13am", "X...
## $ capitol <chr> "X", "X", "X", "X", "X", "X", "X", "X", "X...
## $ blossom_hill <chr> "X", "X", "X", "X", "X", "X", "X", "X", "X...
## $ morgan_hill <chr> "X", "X", "X", "X", "X", "X", "X", "X", "X...
## $ san_martin <chr> "X", "X", "X", "X", "X", "X", "X", "X", "X...
## $ gilroy <chr> "X", "X", "X", "X", "X", "X", "X", "X", "X...Visualizing
So the data should be in a rough enough format to start visualizing. Let’s do it.
First, let’s gather everything up so it’s easier to facet / group by station. For this we’ll use tidyr::gather()
td_g <- td %>%
  gather(
    key='station'
    , value='time'
    , 4:ncol(td)
    , convert = FALSE
    , factor_key = TRUE
  )

# Now let's convert all the times to actual time formats R understands
td_g %<>%
  mutate(
    time = parse_time(time)
  )

glimpse(td_g)
## Observations: 3,782
## Variables: 5
## $ number <int> 102, 104, 206, 208, 210, 312, 314, 216, 218, 220, 32...
## $ type <chr> "N", "N", "L", "L", "L", "B", "B", "L", "L", "L", "B...
## $ direction <chr> "S", "S", "S", "S", "S", "S", "S", "S", "S", "S", "S...
## $ station <fctr> san_francisco, san_francisco, san_francisco, san_fr...
## $ time <time> 04:55:00, 05:25:00, 06:11:00, 06:24:00, 06:44:00, 0...Just as a sanity check, we should have a bunch of new rows per train
kable(td_g %>% filter(number==102) %>% head())| number | type | direction | station | time |
|---|---|---|---|---|
| 102 | N | S | san_francisco | 04:55:00 |
| 102 | N | S | twentysecond_street | 05:00:00 |
| 102 | N | S | bayshore | 05:05:00 |
| 102 | N | S | so_san_francisco | 05:11:00 |
| 102 | N | S | san_bruno | 05:15:00 |
| 102 | N | S | millbrae | 05:19:00 |
The order of the stations is important. Let’s factor the station field and set the levels to the correct order. The train number should also be a factor.
td_g %<>%
  mutate(
    station = factor(
      station
      ,levels=c(
        'san_francisco'     ,'twentysecond_street'  ,'bayshore'
        ,'so_san_francisco' ,'san_bruno'            ,'millbrae'
        ,'broadway'         ,'burlingame'           ,'san_mateo'
        ,'hayward_park'     ,'hillsdale'            ,'belmont'
        ,'san_carlos'       ,'redwood_city'         ,'atherton'
        ,'menlo_park'       ,'palo_alto'            ,'california_ave'
        ,'san_antonio'      ,'mountainview'         ,'sunnyvale'
        ,'lawrence'         ,'santaclara'           ,'college_park'
        ,'san_jose'         ,'tamien'               ,'capitol'
        ,'blossom_hill'     ,'morgan_hill'          ,'san_martin'
        ,'gilroy'
      )
    )
    ,number = as.factor(number)
    ,direction = as.factor(direction)
  )
So the structure of the plot is:
- Time is represented across the x-axis
- The y-axis is each station
- Each Train will be an individual line
We’re missing something important though, the distance the trains are traveling. How can we capture that? I bet that value is what was in the column names before we cleaned them.
Good thing we made a backup of the data in its raw imported form.
cities <- unique(td_g$station)

distance <- c(
  0,   40,   124, 178,
  216, 249,  280, 307,
  334, 354,  391, 428,
  458, 499,  543, 574,
  604, 649,  676, 702,
  731, 757,  805, 833,
  862, 906,  939, 966,
  997, 1021, 1053
  )

city_distances <- data.frame(
  cities = cities
  , distance = distance
  )

kable(head(city_distances))| cities | distance |
|---|---|
| san_francisco | 0 |
| twentysecond_street | 40 |
| bayshore | 124 |
| so_san_francisco | 178 |
| san_bruno | 216 |
| millbrae | 249 |
Then let’s join that in to our td_g table.
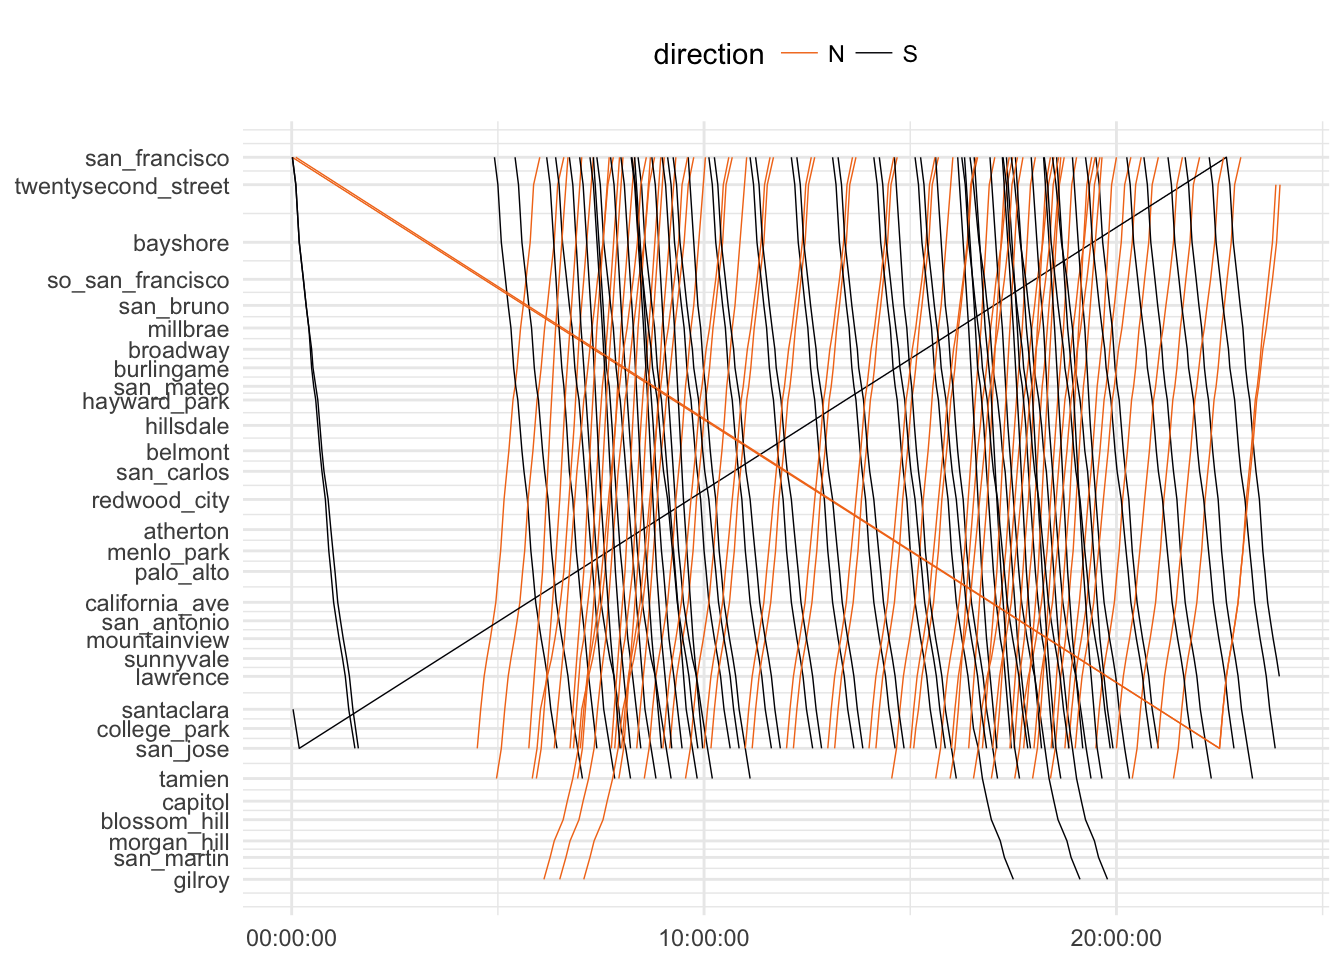
td_g %<>% inner_join(city_distances, by=c('station' = 'cities'))And finally, this should give us something close:
ggplot(
  td_g
  ,aes(
    x = time
    , y = -distance
    , group = number
    , color = direction
  )
) +
  geom_line(size=0.25) +
  theme_minimal() +
  theme(legend.position='top', axis.title = element_blank()) +
  scale_y_continuous(labels = unique(td_g$station), breaks = unique(-td_g$distance)) +
  scale_color_viridis(discrete=T, direction=-1, option = 'B', end = .7)
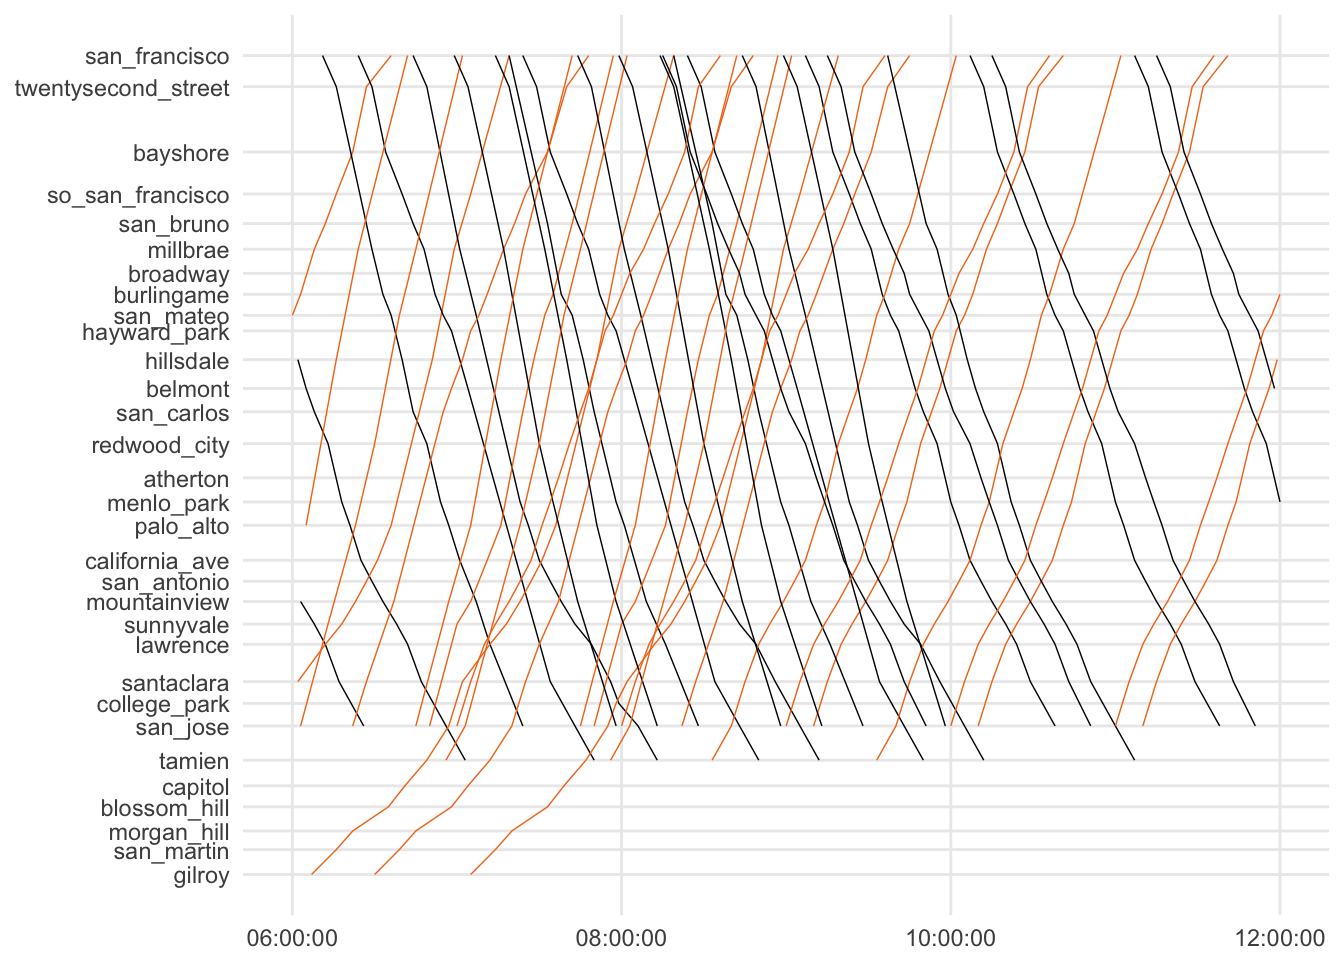
There are some…crazy trains in there. Those are trains that run through midnight to the next day. To make this easier to look at let’s filter to just between 6am and noon.
bad_trains <- c(
  '451','450','197','196'
)

plot_df <- td_g %>%
  filter(
    time >= parse_time('06:00:00')
    , time <= parse_time('12:00:00')
    , !number %in% bad_trains
  )

ggplot(
  plot_df
  ,aes(
    x = time
    , y = -distance
    , group = number
  )
) +
  geom_line( size=0.25, aes( color = direction)) +
  theme_minimal() +
  theme(
    legend.position='none'
    , axis.title = element_blank()
    , panel.grid.minor = element_blank()
  ) +
  scale_y_continuous(
    labels = cities
    , breaks = -distance
    ) +
  scale_colour_viridis(discrete=T, direction=-1, option = 'B', end = .7)
That’s it!